Library Research Power laws and concentration
The 80/20 Rule Isn't Pareto's
Pareto found incomes falling on a straight line in country after country. Juran put Pareto's name on a universal rule, then apologized for it. The shape Pareto found is real, but 80/20 was never a fixed ratio.
Vilfredo Pareto, 1896–97; J. M. Juran, 1951 and 1975
What Pareto was looking at
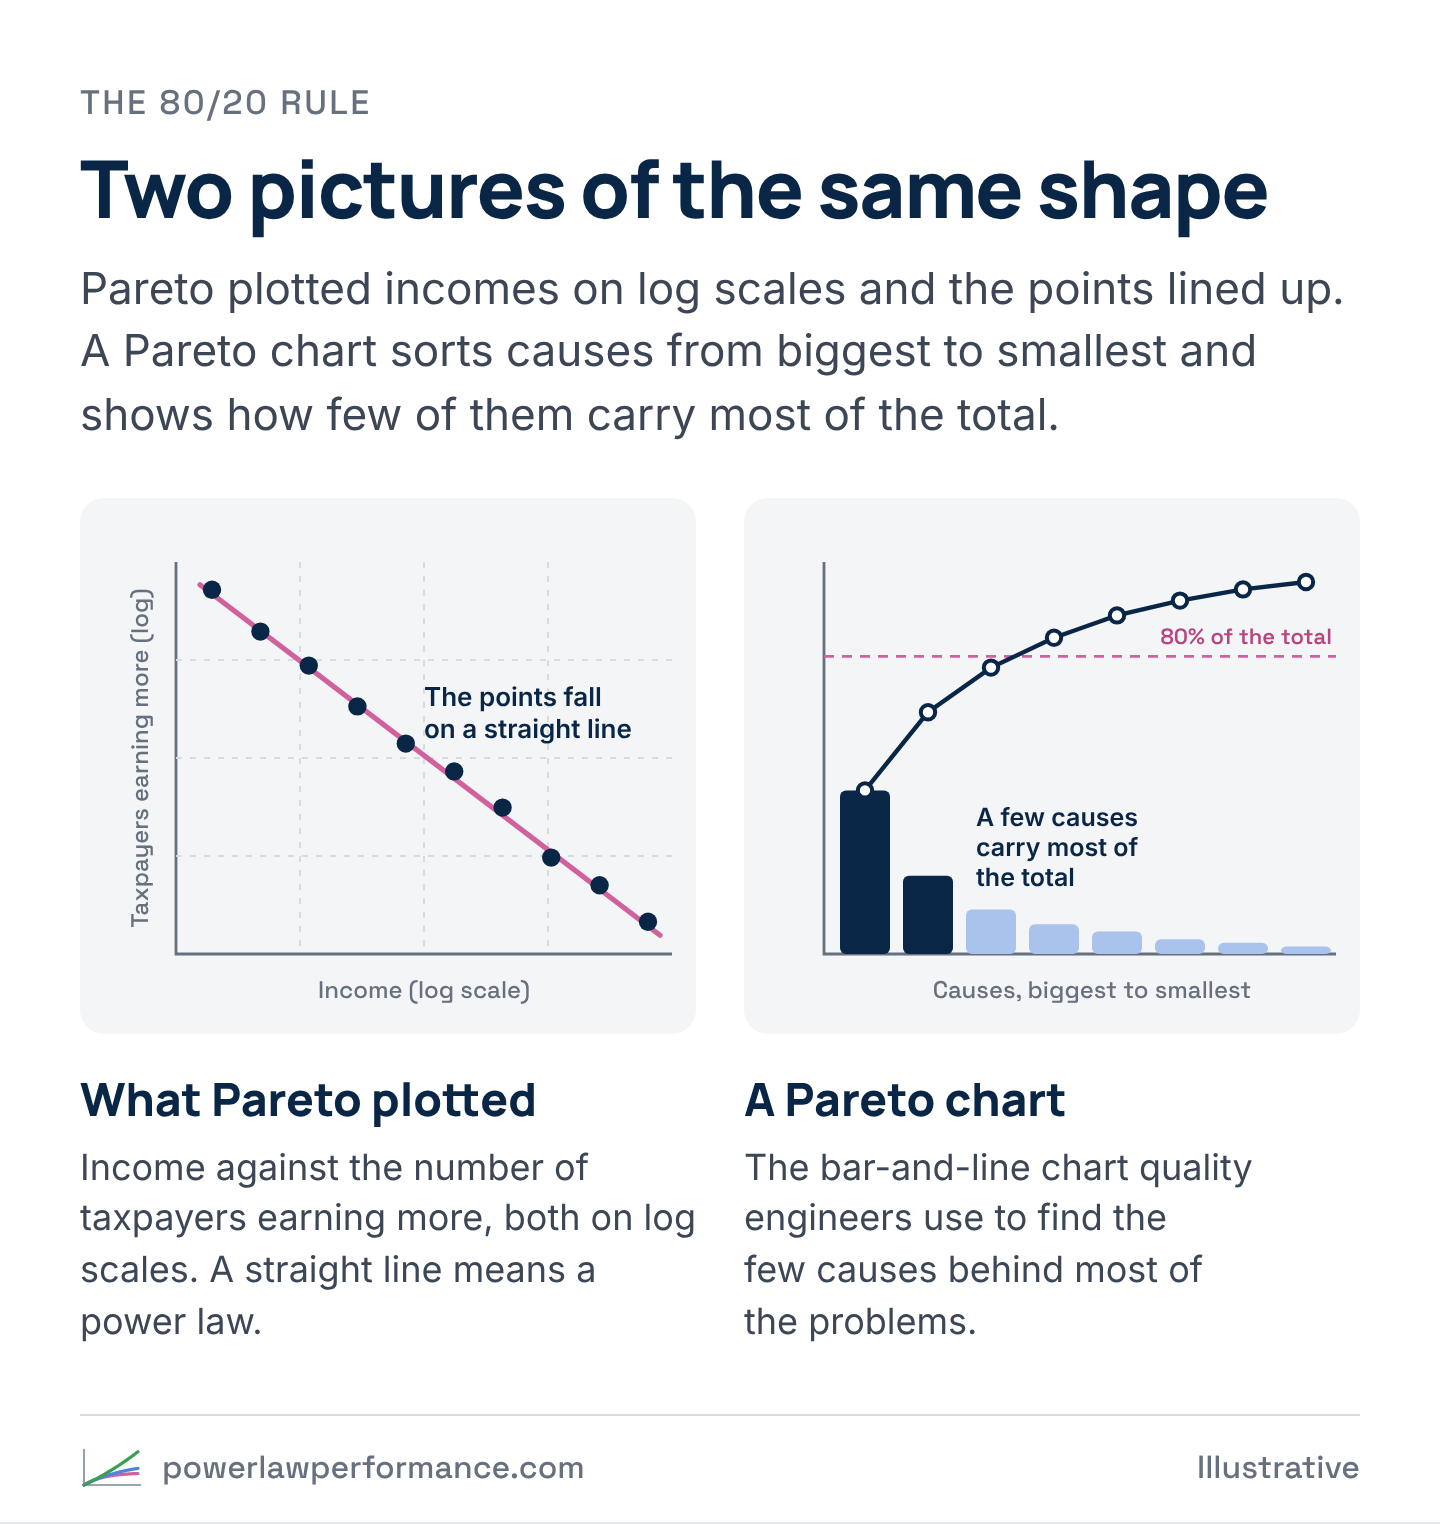
In the 1890s Vilfredo Pareto, an engineer who’d turned economist and was teaching at Lausanne, gathered income-tax records from England, Ireland, Prussia, Saxony, several Italian cities, Basel, Augsburg and Peru. For each one he plotted an income level against the number of taxpayers earning more than that, with both axes on a logarithmic scale.
What he found
What did he see? The points lined up.
“Nous sommes tout de suite frappé du fait que les points ainsi déterminés, ont une tendance très marquée à se disposer en ligne droite.” Pareto, Cours d’économie politique, vol. 2, §958, pp. 304–305. In English: we’re struck at once by how strongly the points tend to fall in a straight line.
And every country’s line had a similar slope. In his table the slopes run from 1.13 to 1.89, across countries and centuries, with England in 1843 at 1.50. Could that be luck? He didn’t think so.
“Il est absolument impossible d’admettre qu’ils sont dus seulement au hasard.” §960, p. 312. In English: it’s absolutely impossible to accept that they’re due to chance alone.
When the points fall in a straight line on those axes, you’re looking at a power law. A small number of people at the top hold a share of the total that’s far out of proportion to how many of them there are, and the pattern repeats however far up the scale you go.
So where does “80/20” come from? Pareto never wrote it. That came half a century later, from a quality engineer named Joseph Juran. At General Motors in the late 1930s, an executive showed him that GM’s executive pay fit one of Pareto’s models. “The fit was surprisingly close,” Juran recalled. He saw the same shape in manufacturing defects, where a few causes produced most of the problems, and in his 1951 Quality-Control Handbook he called it the Pareto principle. Years later he wrote a correction.
“I was forced to confess that I had mistakenly applied the wrong name to the principle.” Juran, “The Non-Pareto Principle; Mea Culpa,” Juran Institute reprint, p. 1
“The Pareto principle as a universal was not original with Pareto.” Same, p. 3
What it means
What Pareto found was the shape. “80/20” is just a nickname for it, and the ratio was never fixed. Some books are more concentrated than that and some are less. A study of more than 100,000 grocery households found the top fifth of a brand’s buyers carry about 73% of its volume, higher for niche brands and lower for big ones.
So what should you ask about your own business? Whether it’s a power law at all. The exact ratio matters a lot less. If it is a power law, you don’t have an average business. You have a power law business, and the average account describes almost nobody. A few large accounts pull the average up, and most accounts sit below it.
Where it shows up in a revenue team
- The average deal. In a power law, most of your deals are smaller than the average deal, so a plan built on the average is counting on a mix you don’t have.
- Targets set on averages. Cost per acquisition, quota and payback targets all inherit the average, and the average is carried by the few. A minority of accounts make up a majority of the results.
- Checking your own shape. Split your accounts at the average value, then split each half at its own average. That gives you above average (A and B) and below average (C and D). If a small share of accounts sits in the top groups and carries most of the revenue, you’re looking at Pareto’s line.