Library Research Correlation and causation
The Question to Ask Before You Pull a Lever
In 1965 Austin Bradford Hill laid out how to tell an association from a cause. His decisive question is one most dashboards skip. If you change this, does that change?
Austin Bradford Hill, 1965
Cholera deaths per 10,000 houses, by water supply
What he was looking at
Austin Bradford Hill was one of the statisticians who showed that smoking causes lung cancer. In January 1965 he gave the presidential address to the occupational medicine section of the Royal Society of Medicine, and he took on a problem every doctor in that room had. A disease shows up more often among workers exposed to something. When is that a cause, and when is it only an association?
He started with what the decision actually comes down to:
“the decisive question is whether the frequency of the undesirable event B will be influenced by a change in the environmental feature A” Hill (1965), p. 295
What he found
Hill didn’t hand out rules. He offered nine viewpoints to weigh before you conclude that an association is a cause. They are strength, consistency, specificity, temporality, biological gradient, plausibility, coherence, experiment and analogy.
“Here then are nine different viewpoints from all of which we should study association before we cry causation.” p. 299
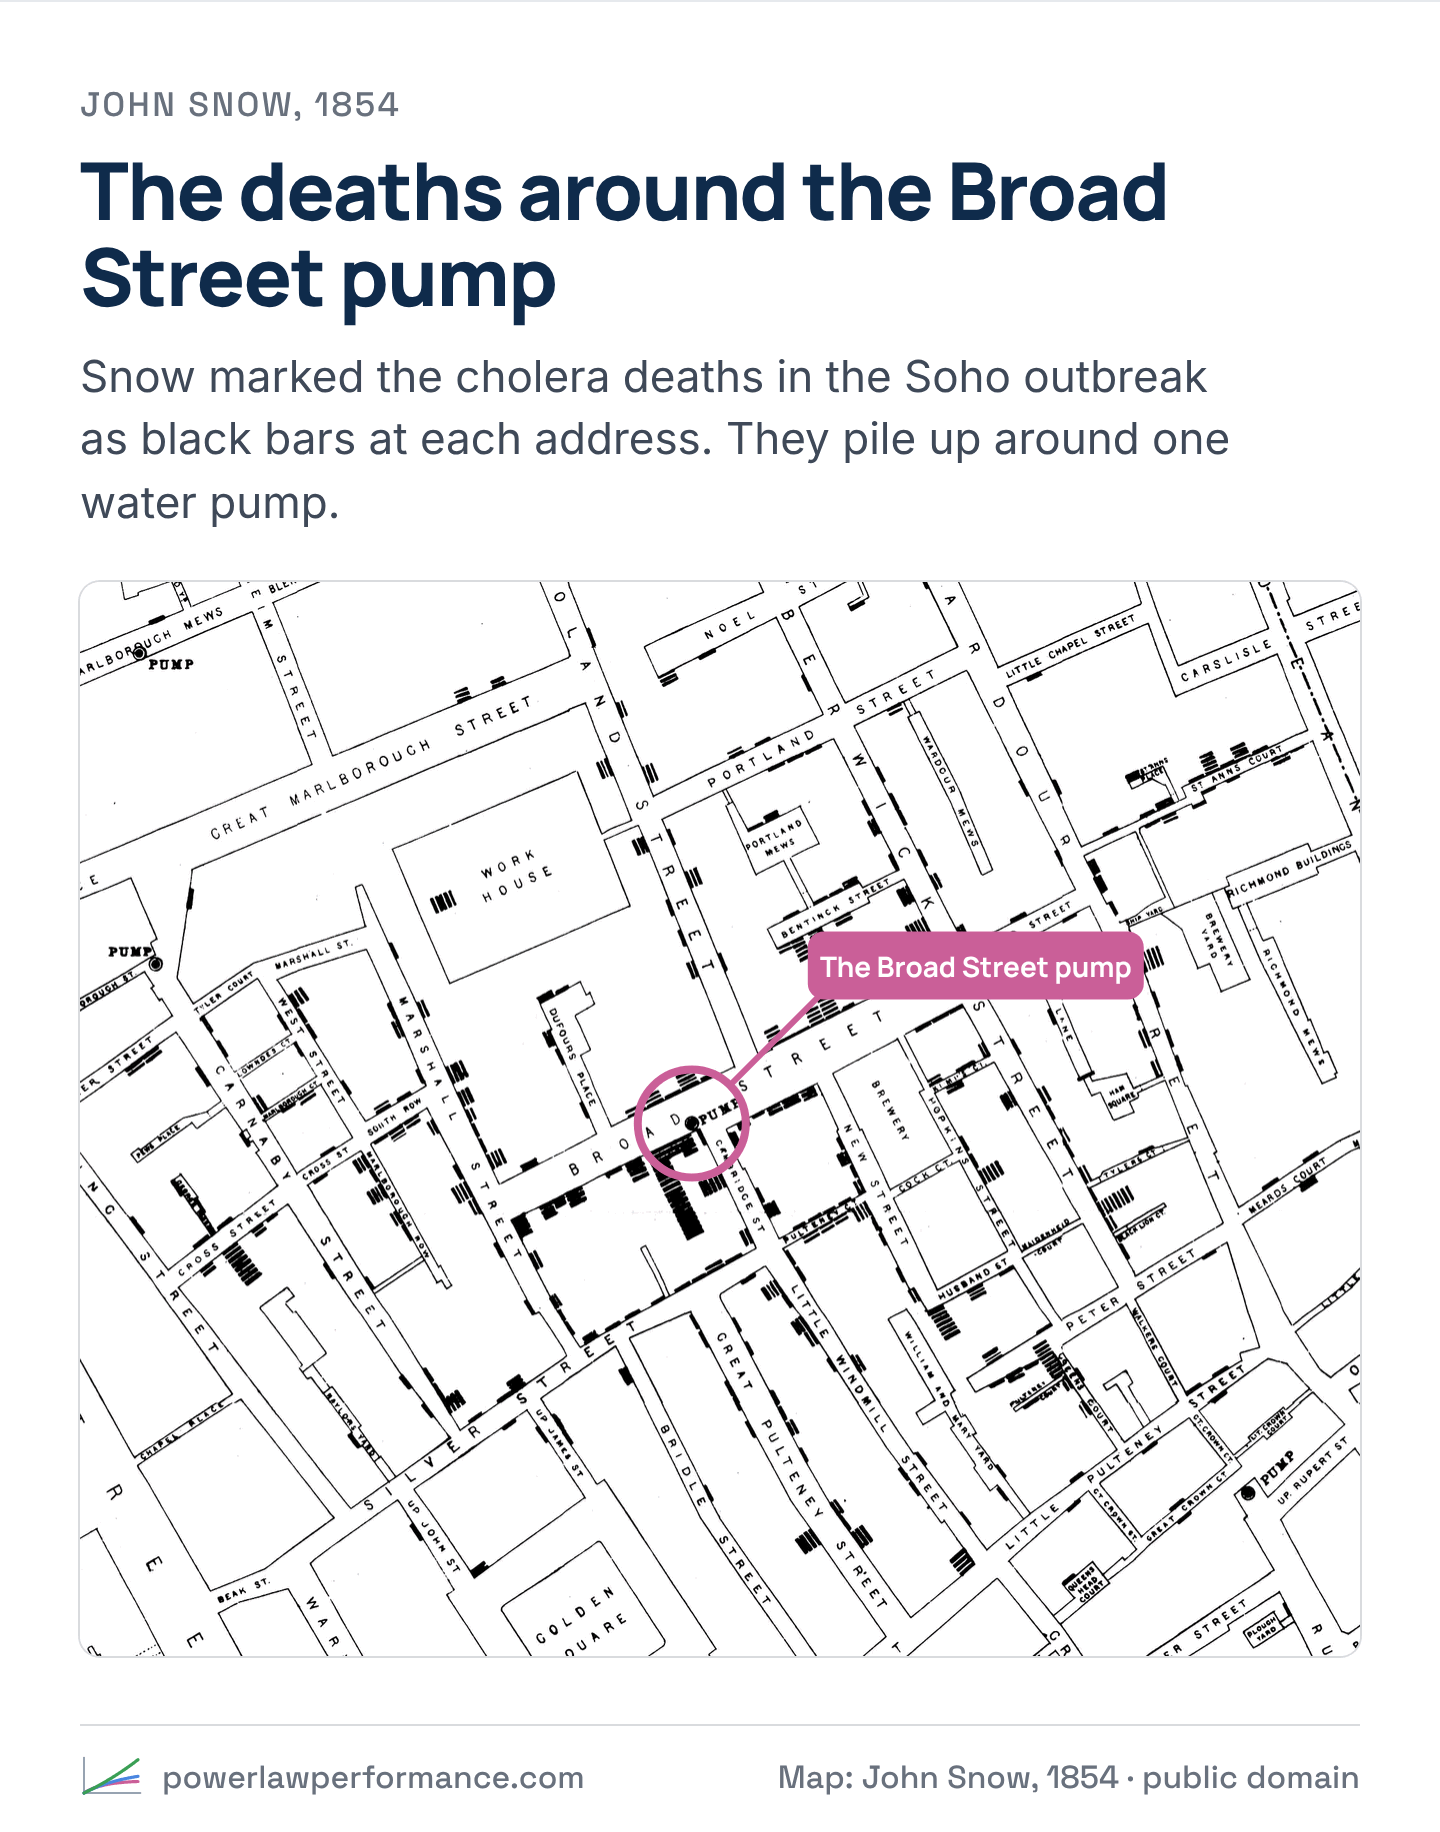
Strength comes first. In his examples, the lung-cancer death rate in cigarette smokers was “nine to ten times” that of non-smokers, and “twenty to thirty times” in heavy smokers. He also used John Snow’s cholera figures, in the chart above, where houses on the polluted water supply had 14 times the deaths.
He was just as clear that no single viewpoint settles it:
“None of my nine viewpoints can bring indisputable evidence for or against the cause-and-effect hypothesis” p. 299
You’ll see them called the “Bradford Hill criteria.” Hill never used that name. He called them viewpoints, and he pushed back on turning them into hard-and-fast rules.
What it means
An association tells you two things move together. When you have a decision to make, Hill’s question is the one that matters. If you change A, does B change?
Some of his viewpoints get you closer without running an experiment, like a strong association, the right order in time, or more of the cause bringing more of the effect. Running the experiment, actually changing A and watching B, gets you closest.
Where it shows up in a revenue team
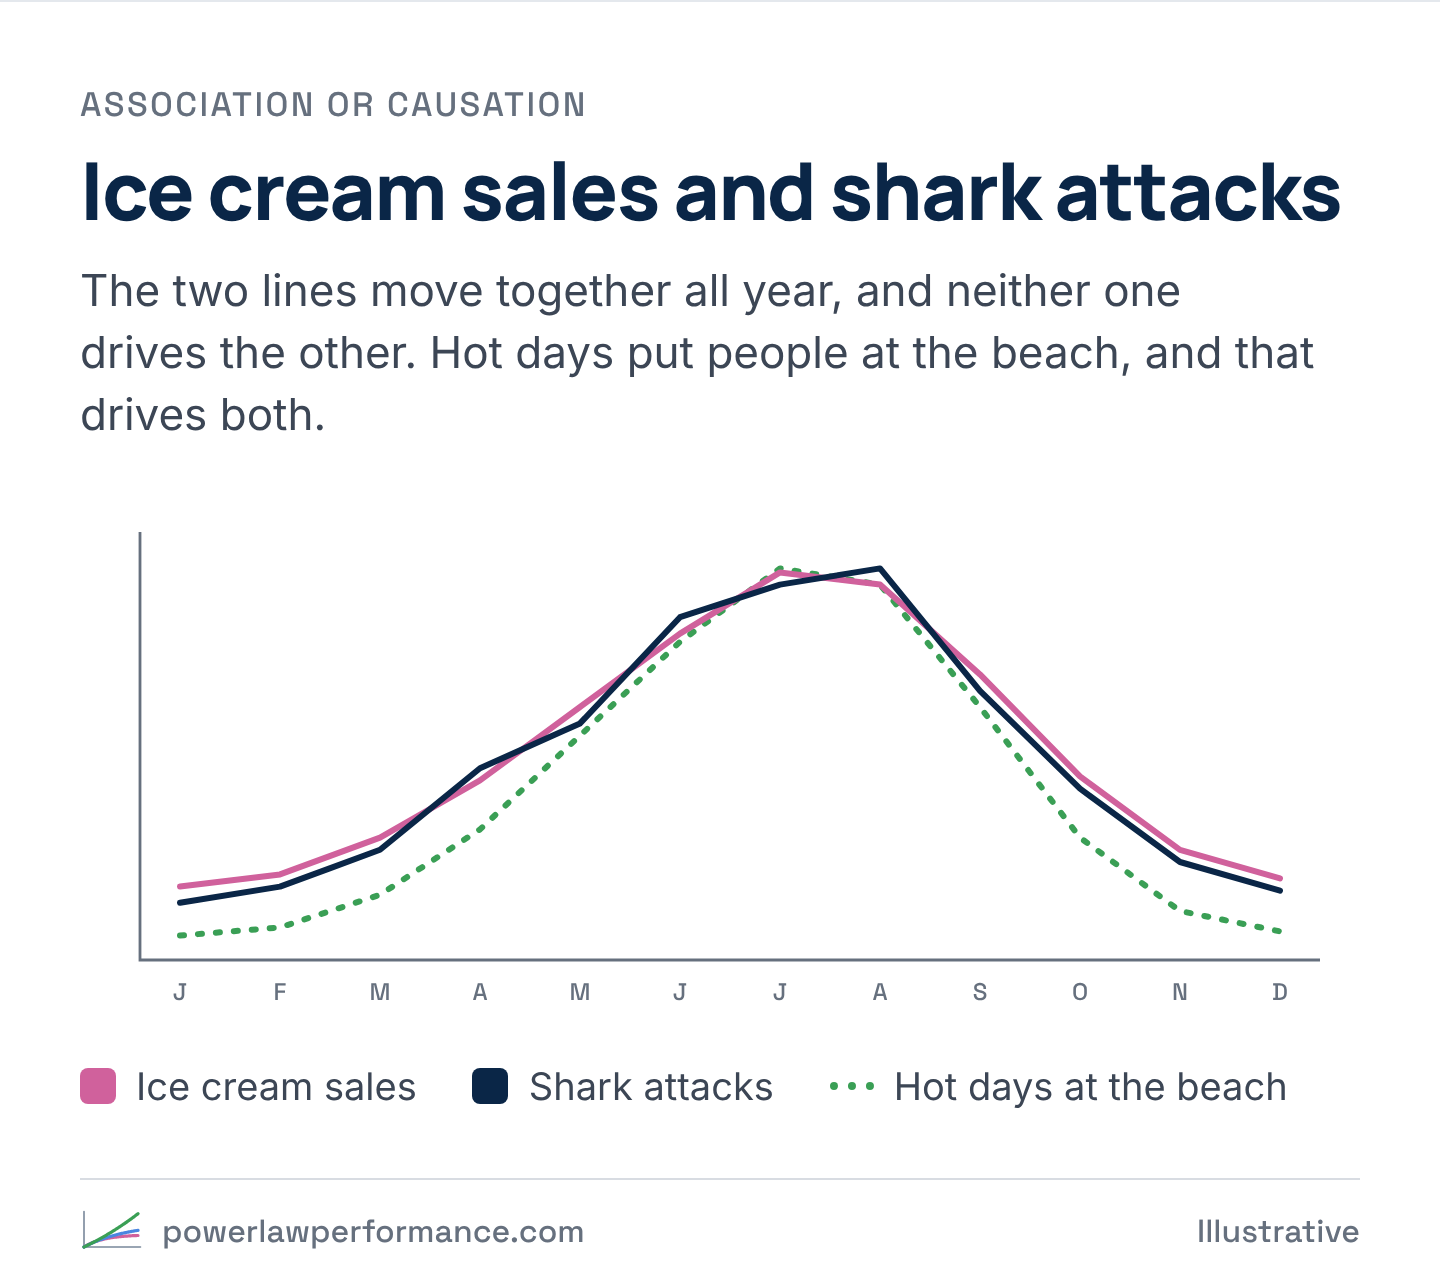
- Ice cream sales “predict” shark attacks. Ask Hill’s question. If the town sold less ice cream, would there be fewer attacks? No. Hot days put more people in the water, and that drives both.
- Temporality. Did the change come before the result? If a campaign gets credit for a lift that started the week before it launched, it fails the first test.
- Gradient. If more of the “driver” should mean more of the result, check that it actually does, within the same segment of customers.
- Experiment. The strongest viewpoint is the one you can actually run, which is a holdout. Change the lever for some customers and not others, and compare.